Understanding Flow Metrics in Software Delivery
While IT frequently collects and presents an abundance of technical metrics regularly, quite often they measure the process and not the outcome. Also referred to as ‘proxy metrics’, these metrics include things like story points delivered, commits per project, test case coverage, build success rate, release duration, and deployments per day.
Good measures of a process are helpful to monitor the performance of a specific activity, but they usually don’t help IT and business leaders optimize the system’s performance as a whole, from customer request to delivery. Furthermore, optimizing something that is not the system’s bottleneck is actually inefficient and counter-productive.
That's why organizations need the ability to measure the entire system - end-to-end - to understand how value flows and where it is constrained, and most importantly, to correlate those metrics with desired business outcomes. Measuring Flow Metrics allows for continuous optimization in the pursuit of delivering greater and greater value to the organization, faster.
Organizations need to optimize performance against business outcomes. End-to-end Flow Metrics help identify and solve the system’s bottleneck, eliminating inefficient local optimizations.
Tasktop helps software delivery organizations deliver more value to the business by learning to measure the right things and using that data to make better decisions.
End-to-end Flow Metrics
There are four Flow Metrics that measure how value flows through a product's value stream. They are calculated on four Flow Items - units of work that matter to a business: features, defects, debt, and risk. Any task or effort a software delivery organization undertakes can be categorized as one of these core Flow Items.
When your goal is to deliver more value, you must measure the value customers actual pull: new features and resolved defects, risk and debt.
The Flow Metrics are:

Flow Velocity
Gauges whether value delivery is accelerating. Flow Velocity is the number of Flow Items of each type completed over a particular period of time.

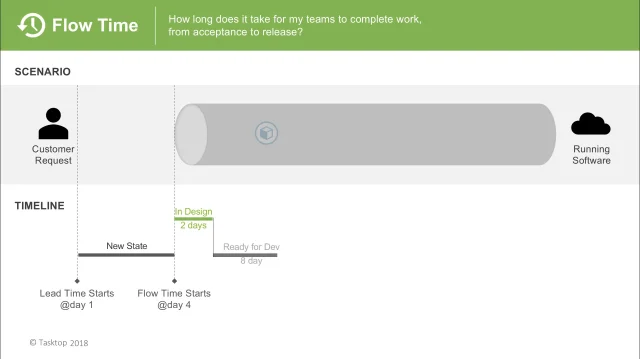
Flow Time
Can identify when Time to Value is getting longer. Flow Time measures the time it takes for Flow Items to go from ‘work start’ to ‘work complete’, including both active and wait times.

Flow Efficiency
Can identify when waste is increasing or decreasing in your processes. Flow Efficiency is the ratio of active time vs. wait time out of the total Flow Time.

Flow Load
Monitors over and under-utilization of value streams, which can lead to reduced productivity. Flow Load measures the number of Flow Items currently in progress within a particular value stream.

Flow Distribution
Helps prioritize specific types of work during specific time frames in order to meet a desired business outcome. Flow Distribution measures the ratio of the four Flow Items completed over a particular window of time.
Correlating Flow Metrics with Business Outcomes
Flow Metrics alone do not help an organization accelerate value delivery. Flow Metrics must be evaluated against business results, the desired outcomes of all this investment. Each value stream is likely to have different desired business outcomes.
Here are some examples of how to correlate Flow Metrics with business outcomes:
- Are shorter Flow Times in Q1 correlated with increased revenue in Q2?
- Does an investment in debt in Q1 (Flow Distribution) result in improved quality (e.g. less escaped defects) in subsequent releases?
- Does an improvement in Flow Efficiency in Q3 result in reduced cost in Q4?
- Does a reduction in Flow Load in Q2 correlate with an improvement in employee NPS scores in Q2?
- Based on this picture, you can calibrate your value stream accordingly - allocate more resources, set priorities, change workflows, modify tooling, etc. until you achieve the desired correlation between Flow Metrics and business results.
Correlating Flow Metrics with business results connects the work being done in each value stream with the business results it’s producing.


Getting Your Value Stream Flow Metrics Dashboard with Tasktop
The data necessary to generate Flow Metrics does not reside in a single tool. It is scattered across many specialized tools used by software delivery practitioners to do their work. Tasktop enables organizations to generate Flow Metrics by connecting the tools that house the data and workflow of your end-to-end value streams and capturing all the digital footprints of work being done.
Tasktop traces flow across all your teams, tools and processes. It relates all the individual bits of work into a measurable stream of activity. The resulting Flow Metrics measure software delivery performance per value stream, in abstracted terms that IT and business leaders can relate to, and which can be easily correlated to business outcomes.
Banking on Flow Metrics – The Bank of New Zealand Transformation Journey
In their presentation at the 2021 DevOps Enterprise Summit, Bank of New Zealand's Chief Technology Officer, Paul Littlefair, and Value Stream Architect, BMK Lakshminarayanan, spoke about BNZ’s transformational journey and how they have been working on establishing the Flow Metrics to continue to innovate, stay ahead of the competition and deliver excellent service and support their customers.
“It’s early in our journey but we’re already seeing value. The teams are committed, excited and engaged and we’re seeing culture improvements because every engineer can now see how their work impacts business delivery and helps support an effective DevOps culture.”
- Paul Littlefair, Banking on Flow Metrics – Bank of New Zealand Transformation Journey, 2021 DevOps Enterprise Summit
Video by permission, IT Revolution
